Visualize
Smarter competitive
analysis for airlines
FareTrack’s innovative Business Intelligence
platform is fully customizable to meet the needs
of modern airline revenue management teams

The most intuitive and responsive fare comparison dashboard available
Visualize can be infinitely extended and customized to meet your exact business intelligence (BI) needs. You can easily integrate internal data (e.g., load or yield factor) with external data (competitive fares) to create uniquely insightful visuals, helping you make better and faster decisions.
Request a Demo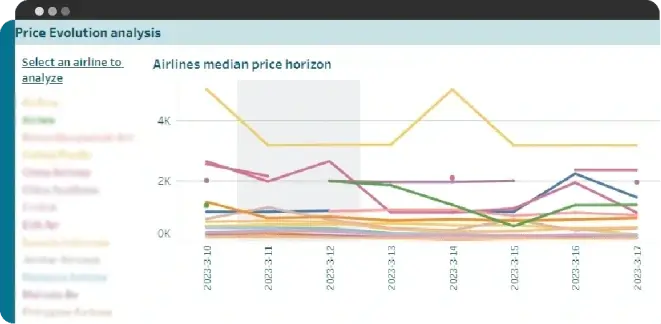

Air Fares per airline, route, cabin & source

Any Origin & Destination – all airlines operated

Full airline scheduling

Only pay for the data you use – no set up fee
No setup fee, no
minimum contract
FareTrack Visualize makes it cost-effective for airlines to monitor the local market. We don’t charge a setup fee, and we don’t make you commit to lengthy contracts. We only charge you for the data you use.
Our cost-effective approach makes FareTrack Visualize the ideal choice for airlines looking to equip airline revenue management and pricing teams with complete and accurate data.
Key platform features
Simple Competitor Analysis
Visualize competitor’s fare evolution and identify emerging market patterns to optimize your revenue strategy
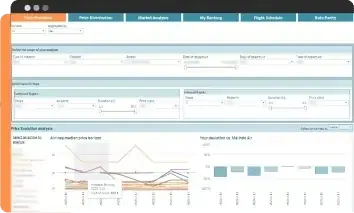
Monitor Price Evolution
FareTrack’s simple visualization makes it easy to benchmark your fares against competitors based on schedule, duration, connections a more.
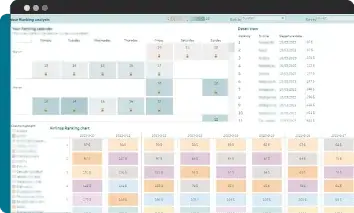
Price Ranking
Identify your rank by price & duration to discover your competitiveness in the market.
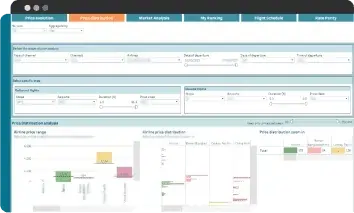
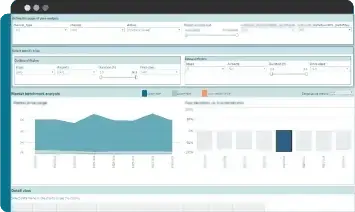
Price Distribution
Analyze full comprehensive price distribution of each airline to understand brand.com pricing strategy
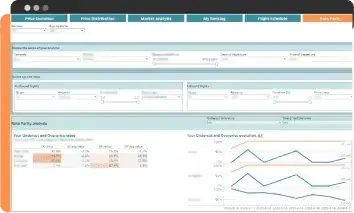
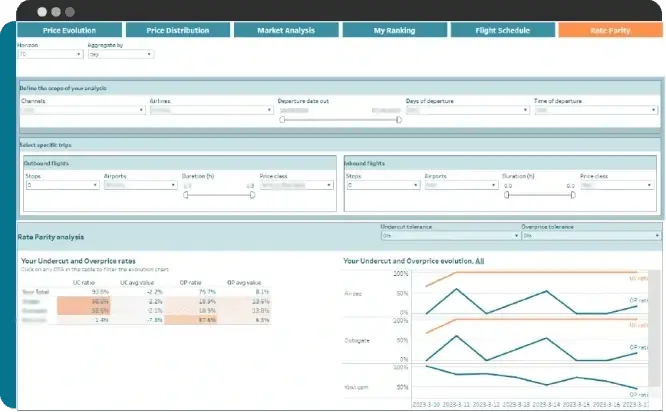
Rate Parity
See how often your flights are undercut or overpriced, by how much vs. your price and on which OTAs
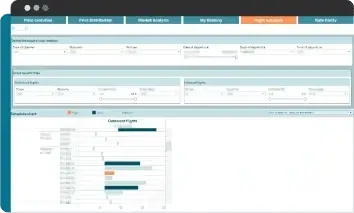
Flight Schedule
See the flight schedule of each airline as separate outbound and inbound schedules or view them as combined
Unlock smarter competitive analysis
Our business intelligence platform quickly transforms data into easy-to-understand, actionable insights.
With customizable visuals that render instantaneously, airline revenue managers can identify competitive opportunities, understand market dynamics and make informed pricing decisions.
Quick & easy set-up
After initial set-up (within 24 hours or less) your personalized benchmarking visualization dashboard will be available. Log in with your team’s shared account and immediately identify your competitor’s pricing patterns. And even better there’s no integration with your internal IT or revenue systems.
Request a Demo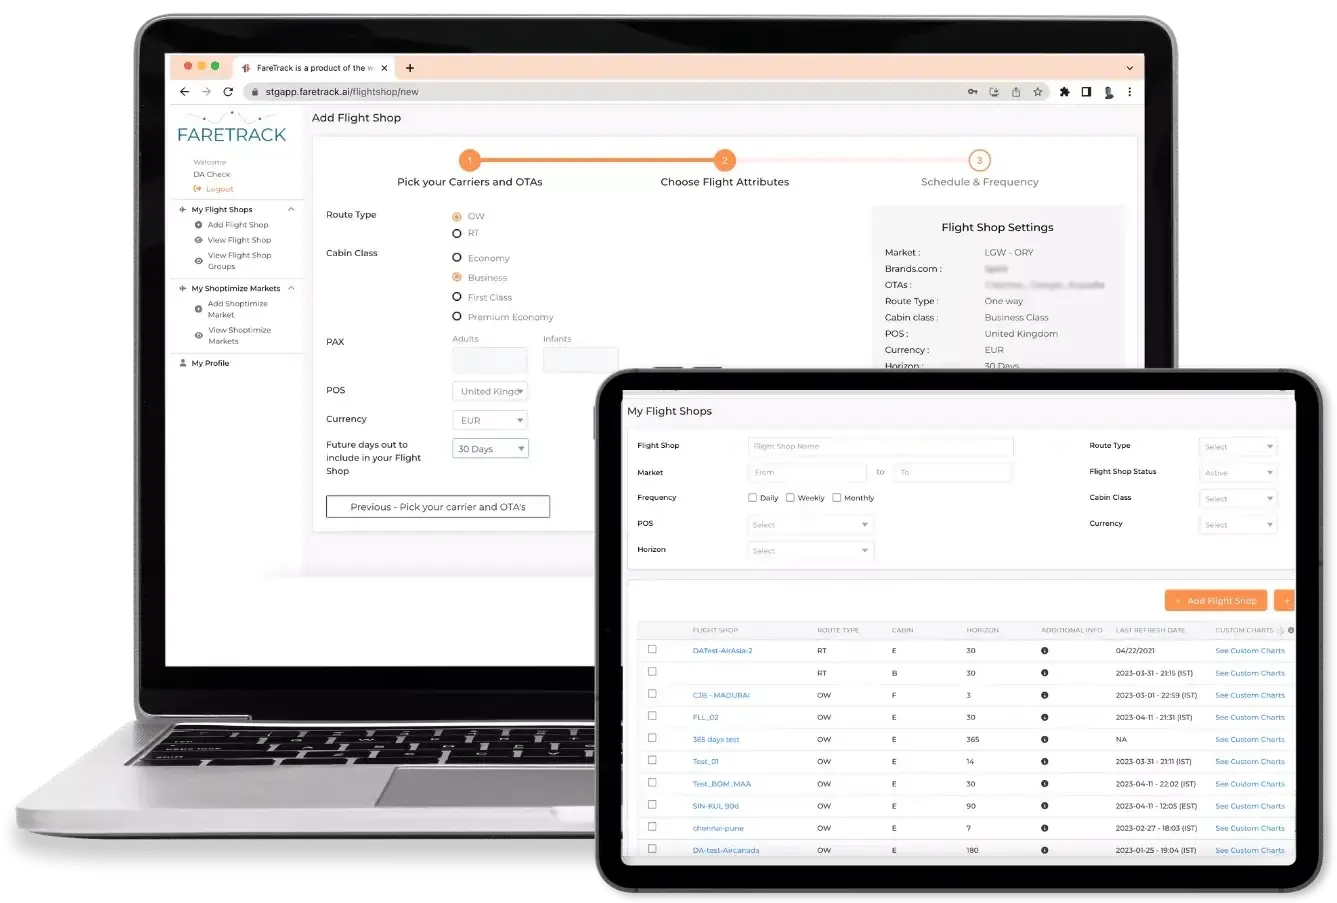
Why Choose FareTrack Visualize?
Daily schedule changes allow customers to react immediately to changes in prices and availability.
Compare prices according to fare type, rules, and baggage, ensuring the correct product comparison.

Market fare analysis allows FareTrack users to understand their fare position in the market.
Daily price change monitoring allows our customers to focus on fare optimization rather than manually checking for changes.
Comparing fares across OTAs or Meta-searches allows revenue teams to monitor rate parity.

Fare benchmarking allows FareTrack users to ensure the prices they offer are optimized against their competition
Explore The Latest FareTrack Resources


Frequently Asked Questions
How does the visualize free trial work?
You will get access to one route of your choice for 30 days. Simply let us know the route you want to access data insights for, and our team will set you up. For the trial, the data will come only from one source.
How much time will it take to set up?
Single O&Ds can be set up immediately. The fares refresh overnight. Large numbers of O&Ds can be uploaded by our support team, within 24 hours. In some cases, set up time may vary subject to the source.
Can I incorporate internal and external data into the visualizations?
Yes, our visualizations are entirely flexible to your needs. Internal and external data, such as load factors, can be incorporated to create a more personalized visualization.
Does Visualize incorporate Tableau?
Yes, visualize incorporates Tableau, the leading data visualization and business intelligence software. It provides a powerful and intuitive way to analyze, visualize, and share data with others.