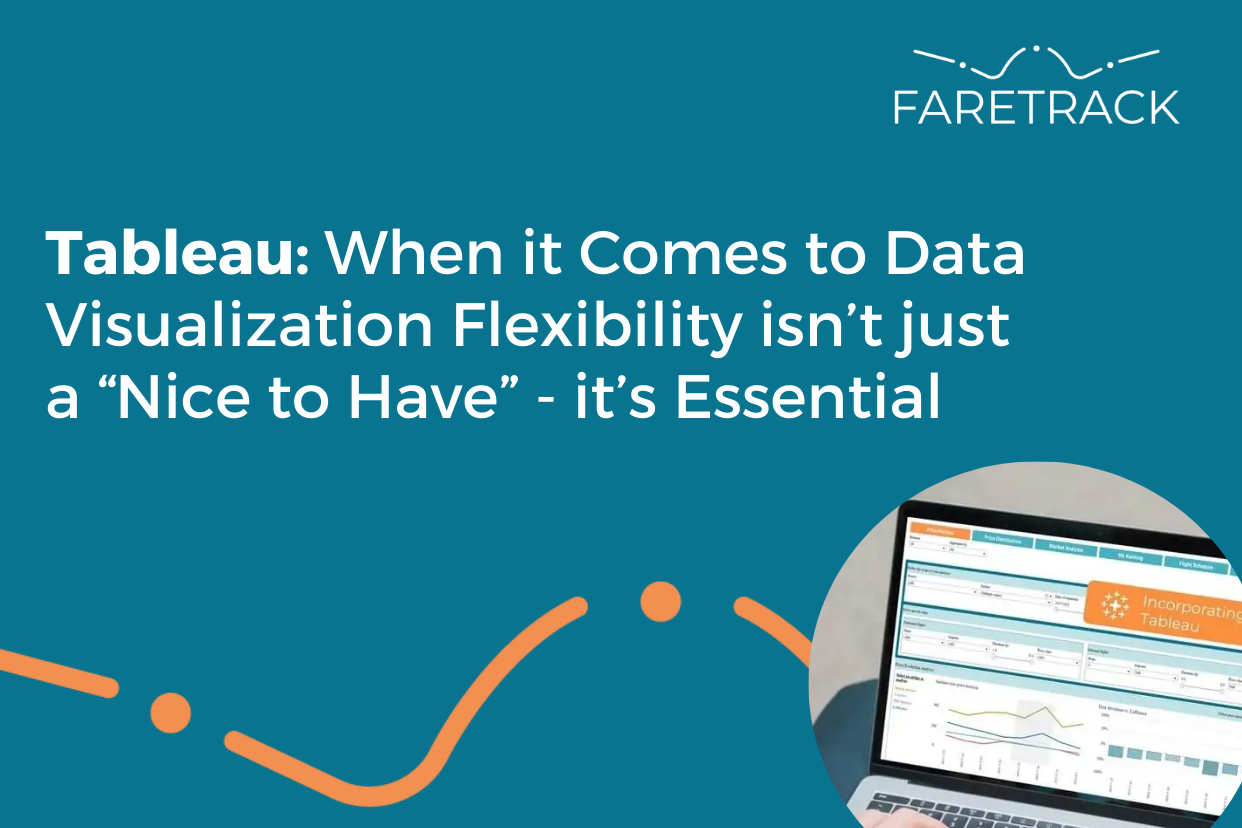
Data visualization flexibility is not just a luxury; it is a necessity, especially in the ever-evolving airline industry. With the introduction of NDC, increasing use of AI and Machine Learning, and other fundamental changes, the way airlines use and visualize data must undergo a transformation as well. While standardized graphs and reports have been the norm for many airlines when comparing fares against competitors, they fall short in capturing the complete story, particularly in dynamic market conditions.
Consider this scenario: your current data supplier provides competitor pricing information for a specific Origin and Destination (O&D). This information allows you to quickly assess how your fare compares to that of your competitors, aiding you in making informed pricing decisions. However, this graph only provides a partial view, lacking the additional insights necessary for making the best strategic revenue choices. It fails to incorporate crucial external data, such as load factor or yield, which requires you to carry out additional analysis externally from your current supplier dashboard. As a result, you end up investing more time and resource while potentially comparing outdated data. This highlights the significance of adopting a flexible approach to data visualization.
In an industry characterized by volatile and rapidly changing pricing dynamics, the ability to swiftly assemble a comprehensive picture becomes critical. Modern airlines require equally modern and flexible tools for data exploration and analysis. They need the ability to interrogate data, apply filters, sort and group information, and uncover patterns, trends, and outliers. Dynamic and interactive dashboards that consolidate multiple visualizations into a single view are essential, allowing users to drill down into data, apply real-time filters, and interact with visualizations. Such tools enable airlines to explore data from various perspectives and gain deeper insights into competitor pricing strategies.
In the airline market, making decisions without the necessary data exposes you to lost revenue and reduced competitiveness. As the great Sherlock Holmes once said, “It is a capital mistake to theorize before one has data.” Hence, having access to comprehensive and up-to-date data is crucial.
If you are seeking more from your data visualization, we encourage you to reach out to the FareTrack team. Our visualizations incorporate Tableau, providing you with nearly limitless possibilities for interacting with and viewing your data. Additionally, we can incorporate external data to ensure that the visualizations you observe are entirely relevant to your business needs and decision-making processes.